Mastering Forex Chart Patterns: A Guide to Continuation Patterns, Risk Management, and Price Movements
Forex chart patterns are powerful tools that traders use to analyze price movements and make informed trading decisions. In this article, We will explore various aspects of forex chart patters and their significance in technical analysis. Those patters includes, continuation patterns, risk management, prevailing trends, reversal chart patterns, and their significance in technical analysis. Also, we will give you more information on specific patterns including:
- Rising wedge,
- Cup and handle,
- Head and shoulders,
- Double top and bottom,
- Falling wedge
We will also focus on the importance of involving candlestick patterns and price action and analysis. So let's start!
Understanding Continuation Patterns and Their Significance:
Continuation patterns offer traders a strategic advantage by providing valuable information about the market sentiment and potential price movements. When a continuation pattern appears, it indicates that buyer or sellers are taking a temporary break. They are consolidating their positions and preparing for the next phase of the trend.
By recognizing and understanding continuation patterns, traders can effectively identify potential entry points in alignment with the prevailing trend. This allows them to join the market at opportune moments, increasing the probability of capturing profitable trades.
These patterns act as a roadmap, guiding traders towards areas where the price is likely to resume its previous direction. Traders can use various technical analysis tools and indicators in conjunction with continuation patterns. In order to validate their trading decisions and enhance their overall strategy.
For example, if an uptrend is established, a flag pattern may form, indicating a temporary consolidation phase. Traders who identify this pattern can strategically position themselves to enter long positions when the price breaks out of the flag formation and resumes its upward movement. This approach enables traders to ride the trend and maximize their potential profits.
Similarly, in a downtrend, a descending triangle pattern may appear, representing a temporary pause before the price continues its downward trajectory. Traders who recognize this pattern can consider short-selling opportunities when the price breaks below the lower trendline of the triangle, confirming the continuation of the downtrend.
Continuation patterns also play a crucial role in risk management. By identifying these patterns, traders can set appropriate stop-loss levels, minimizing potential losses if the market unexpectedly reverses. Furthermore, these patterns provide traders with a clear framework for defining their profit targets, allowing them to establish realistic expectations and optimize their risk-reward ratios.
It is worth noting that no trading pattern guarantees success in every instance. Traders should always exercise caution and combine continuation patterns with other technical analysis tools, fundamental analysis, and risk management strategies to make well-informed trading decisions.
In conclusion, continuation patterns are powerful tools that offer traders insights into market sentiment and potential price movements. By understanding and applying these patterns effectively, traders can identify entry points aligned with the prevailing trend, enhance their risk management strategies, and increase their chances of capturing profitable trades. Continuation patterns, when used in conjunction with other analytical techniques, form a robust foundation for successful trading strategies.
Risk Management and the Importance of Prevailing Trends:
When trading forex chart patterns, it is crucial to prioritize risk management. This involves implementing proper position sizing, setting stop-loss orders, and determining realistic profit targets. One key factor in risk management is understanding the prevailing trend. By analyzing the overall market direction and identifying whether it is bullish or bearish, traders can align their trades with the underlying momentum. It is generally considered safer to trade in the direction of the prevailing trend, as this increases the probability of a successful trade.
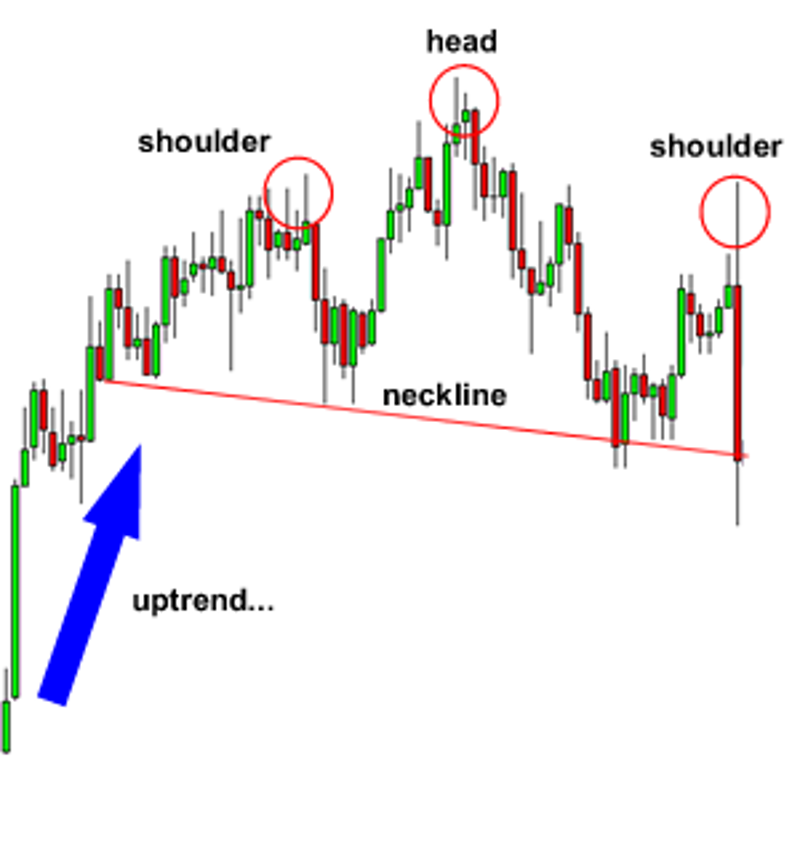
Reversal Chart Patterns: The Head and Shoulders Pattern:
Reversal chart patterns signal a potential change in the direction of the prevailing trend. One of the most well-known reversal patterns is the head and shoulders. This pattern consists of three peaks, with the middle peak (the head) being higher than the two surrounding peaks (the shoulders). A head and shoulders pattern indicates a shift from a bullish to a bearish trend or vice versa. Traders often wait for a confirmation of the pattern, such as a neckline break, before entering a trade.
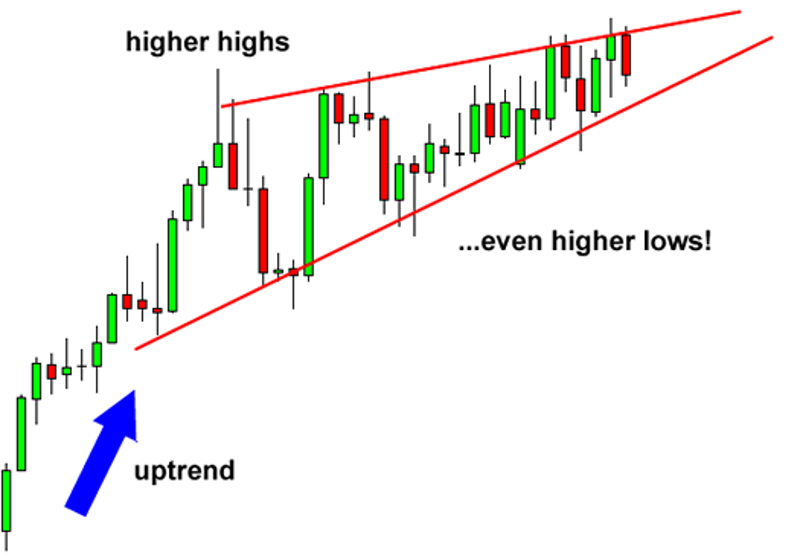
The Rising Wedge: A Bearish Continuation Pattern:
The rising wedge is a continuation pattern characterized by converging trendlines slanted in the opposite direction of the prevailing trend. It suggests that the market is experiencing a temporary pause in a bearish trend before it continues downward. Traders look for a breakout below the lower trendline as a confirmation of the pattern, indicating a potential opportunity to enter a short trade.
The Cup and Handle Pattern: A Bullish Continuation Signal:
The cup and handle pattern is a bullish continuation formation that resembles a cup with a handle. It signifies a temporary consolidation phase before the underlying uptrend resumes. Traders often look for a breakout above the resistance line of the cup as confirmation of the pattern. This indicates a potential opportunity to enter a long trade.
186.png)
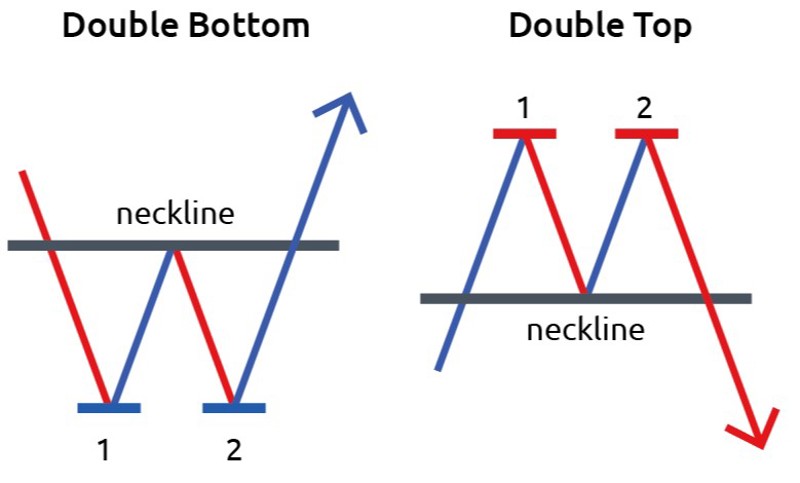
Double Top and Double Bottom Patterns:
The double top and double bottom patterns are reversal formatşons that occur when the price reaches two consecutive peaks. A double top patterns signals a potential trend reversal from bullish to bearish. While a double bottom pattern indicates a reversal from bearish to bullish. Traders often wait for a confirmed breakdown or breakout from the pattern before entering trades.
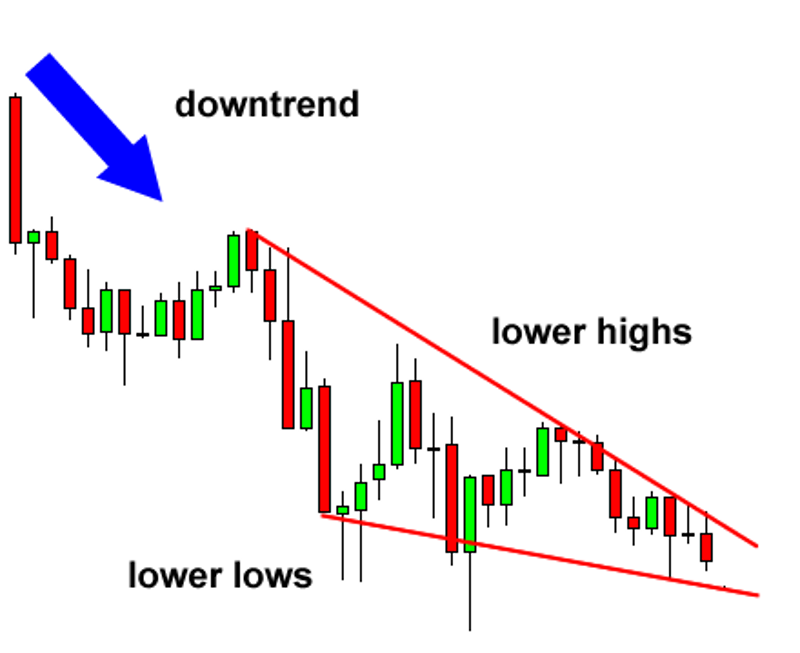
The Falling Wedge: A Bullish Reversal Pattern:
The falling wedge is a bullish reversal pattern characterized by converging trendlines slanted in the direction opposite to the prevailing downtrend. It suggests a temporary pause in the bearish trend, indicating a potential reversal. Traders wait for a breakout above the upper trendline as confirmation of the pattern, signaling a potential opportunity to enter a long trade.
Incorporating Candlestick Patterns and Price Action Analysis:
In addition to chart patterns, traders often utilize candlestick patterns and price action analysis to enhance their technical analysis. Candlestick patterns, such as doji, engulfing patterns, and hammer, provide insights into market sentiment and potential reversals. Price action analysis involves studying the patterns and formations formed by price alone, without relying on indicators. It helps traders understand the market dynamics, support and resistance levels, and potential trend reversals.
Conclusion:
Forex chart patterns are indispensable tools in the realm of technical analysis, empowering traders to navigate the complexities of the market and make informed trading decisions. Among these patterns, continuation patterns and reversal patterns hold significant importance.
Continuation patterns, as mentioned earlier, signify temporary pauses in the prevailing trend. They serve as indicators that the market is taking a breather before continuing in the same direction. By recognizing continuation patterns, traders can anticipate the resumption of the trend and strategically position themselves to capture potential trading opportunities. Whether it's a flag pattern, a pennant, or a symmetrical triangle, these patterns provide valuable insights into the market sentiment and the balance between buyers and sellers.
On the other hand, reversal patterns indicate potential trend changes. These patterns often emerge when the prevailing trend exhausts itself and is ready to reverse. Recognizing reversal patterns is crucial for traders looking to exit positions or even consider trading in the opposite direction. Popular reversal patterns include head and shoulders, double tops, and double bottoms. These patterns, when confirmed, offer traders opportunities to capitalize on major trend reversals and profit from significant price movements.
To effectively utilize chart patterns in forex trading, it's crucial to consider various factors beyond their mere presence. Traders must assess the prevailing trend and understand its strength and duration. Is the trend well-established or showing signs of weakness? Additionally, implementing risk management strategies is essential to protect capital and manage potential losses. Setting appropriate stop-loss orders and position sizing based on the analysis of chart patterns can help traders mitigate risks and enhance their overall trading performance.
Incorporating candlestick patterns and price action analysis alongside chart patterns further enhances traders' understanding of market dynamics. Candlestick patterns, such as doji, engulfing patterns, and hammers, provide insights into market sentiment and potential trend reversals. Price action analysis, which involves studying the behavior of price movement itself, helps traders interpret the market's response to specific patterns and identify key support and resistance levels.
Mastering these concepts and patterns requires dedication, practice, and continuous learning. By honing their skills in technical analysis, traders can gain a competitive edge in the fast-paced and ever-changing forex market. Additionally, keeping a journal of trades, analyzing performance, and adapting strategies based on lessons learned from chart patterns contribute to long-term success.
In conclusion, forex chart patterns are invaluable tools for traders. Continuation patterns offer insights into temporary pauses in the prevailing trend, while reversal patterns indicate potential trend changes. Understanding the prevailing trend, implementing risk management strategies, and incorporating candlestick patterns and price action analysis are all essential components of successful forex trading. By mastering these concepts and patterns, traders can enhance their decision-making process and improve their chances of success in the dynamic and exciting world of forex trading.